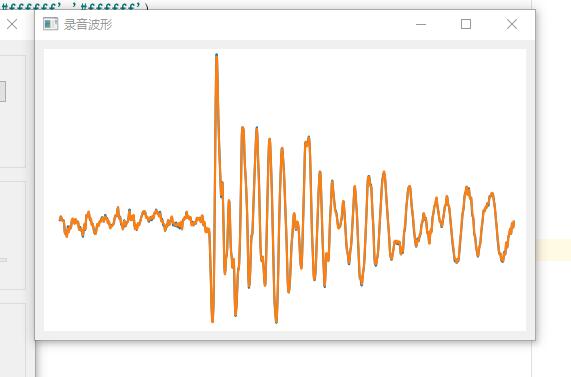
PyQt5 制作实时声波图
2019-09-01 python 4368
给一个完整的例子,利用matplot画动态的图
import sys
import numpy as np
from PyQt5.QtWidgets import QMainWindow,QWidget,QApplication,QDesktopWidget,QPushButton,QVBoxLayout
from PyQt5.QtCore import QThread,pyqtSignal,QTimer

import matplotlib.pyplot as plt
from matplotlib.backends.backend_qt5agg import FigureCanvasQTAgg as FC

class QtDraw(QMainWindow):

    def __init__(self):
        super().__init__()
        self.initUI()

    def initUI(self):
        # matlib PyQt5

        print("matplotlib")
        # 载入matplotlib
        self.fig = plt.figure(0,None,72,'#ffffff','#ffffff')

        # frame = plt.gca()
        # # y 轴不可见
        # frame.axes.get_yaxis().set_visible(False)
        # # x 轴不可见
        # frame.axes.get_xaxis().set_visible(False)


        self.canvas = FC(self.fig)
        self.btn_start = QPushButton("开始")
        self.btn_start.clicked.connect(self.draw)

        self.timer = QTimer()
        self.timer.setInterval(100)
        self.timer.start()

        self.ax = self.fig.add_subplot(111)
        #plt.tight_layout(pad=-10, h_pad=0, w_pad=0)
        #self.ax.axis('off')
        self.timer.timeout.connect(self.draw)


        v = QVBoxLayout()
        v.addWidget(self.btn_start)
        v.addWidget(self.canvas)
        w = QWidget()
        w.setLayout(v)

        self.setCentralWidget(w)

        self.setGeometry(300,300,800,600)
        self.center()
        self.setWindowTitle("PyQt5 与 matplotlib")

    def draw(self):
        #print("绘画开始")
        try:
            x = np.linspace(0,100,100)
            y = np.random.random(100)
            #x = np.arange(-2*np.pi,2*np.pi,0.01)
            #y = np.sin(x) / x
            #y1 = np.sin(x*2) / x

            #plt.xlabel(r'x', color='r', fontsize=18)
            #plt.ylabel(r'y', color='r', fontsize=18, rotation=360)
            #print(x,y)

            self.ax.cla() #删除原图,让画布上只有新的一次的图
           # self.ax.axis('off')
            self.ax.plot(x,y)

            self.canvas.draw()

        except Exception as e:
            print(str(e))
    def center(self):
        qr = self.frameGeometry()
        cp = QDesktopWidget().availableGeometry().center()
        qr.moveCenter(cp)
        self.move(qr.topLeft())


if __name__ == "__main__":
    app = QApplication(sys.argv)
    draw = QtDraw()
    draw.show()
    sys.exit(app.exec_())
上面的是画图
在绘制声波图有几个重要的点:
1 首先使用声波获取的流信息,生成一个Queue
def rec(self, outpath, record_second, rate=48000, channels=2):
    CHUNK = 1024
    FORMAT = pyaudio.paInt16
    CHANNELS = channels
    RATE = rate
    self.channels = CHANNELS

    print("-------------------------------Rate:%d Channels:%d outpath: %s" % (RATE, CHANNELS, outpath))

    self.p = p = pyaudio.PyAudio()

    self.stream = p.open(format=FORMAT,
                         channels=CHANNELS,
                         rate=RATE,
                         input=True,
                         frames_per_buffer=CHUNK)
    self.wf = wf = wave.open(outpath, 'wb')
    wf.setnchannels(CHANNELS)
    wf.setsampwidth(p.get_sample_size(FORMAT))
    wf.setframerate(RATE)

    # 写入文件
    # bitRate = int(RATE / CHUNK * record_second)
    while True:
        #print("level 1")
        if self.recState == "pause":
            self.setPauseState()

        if self.recState == "stop":
            self.stream.stop_stream()
            print("pause* done recording")
            self.stream.close()
            p.terminate()
            wf.close()
            break
        try:
            data = self.stream.read(CHUNK)
            wf.writeframes(data)
            self.q.put(data) #-----------------------------------------------添加到队列
        except Exception as e:
            print(str(e))
    self.stream.stop_stream()
    print("all * done recording")
    self.stream.close()
    p.terminate()
    wf.close()
引用队列数据:
# 读取 steam 队列
# 获取一条  其他扔掉  没必要所有的流 因为这太庞大了 秒秒钟 让内存爆掉
data = self.reca.q.get()
while not self.reca.q.empty():
    self.reca.q.get()

self.triggerStream.emit(data)
创建画布
self.fig = plt.figure(0,None,72,'#ffffff','#ffffff')
plt.xticks([])
plt.yticks([])
plt.tight_layout(pad=0,h_pad=0,w_pad=0)
self.canvas = FC(self.fig)
self.ax = self.fig.add_subplot(111,frameon=False)
self.ax.axis('off')
plt.tight_layout(pad=-1, h_pad=0, w_pad=-5) #设置 图形布局
生成声波图
w = np.fromstring(data,dtype=np.int16)
#w = np.frombuffer(data, np.dtype("<i2"))

w = w * 1.0 / (max(abs(w)))
w = np.reshape(w, [1024, self.reca.channels])

self.ax.cla()  # 删除原图,让画布上只有新的一次的图
self.ax.axis('off')  #隐藏 坐标轴
self.ax.plot(w)

self.canvas.draw()
很赞哦! (0)
相关文章
文章评论
-
-
-
0条评论


